
A rally that doesn't feel like one
This unimpressive trading pattern to continue this week as well.

Welcome to Ticker, Mint’s latest newsletter by Vijay L. Bhambwani to help you navigate India’s stock market. His approach is technical, analysis incisive—a must-read for the seasoned investor as well as the newbie testing the choppy waters of Dalal Street.
Last week, I wrote that you should be ready for a see-saw market that tests your patience with its sporadic, knee-jerk volatility. Markets lived up to my hypothesis based on the statistical weight of evidence. Even though headline indices notched up mild gains, the markets barely felt bullish. This is because the action was polarised around selected segments of the markets. Index-weighted stocks were particularly active, which explains why both indices gained.
This week, too, I expect this unimpressive trading pattern to continue. Retail traders appear cautious, as margin-funded trading (broker-funded buying) data indicates. The commitment levels have fallen 0.46% on a week-on-week basis. As you read on, you will get a feel of why the markets may appear to rally, your portfolio need not move in lockstep.
Last week, I estimated that banking and financial sector stocks would run into resistance after the Reserve Bank of India announced new provisioning norms. That was evident in the markets. With these stocks carrying a weightage of 35.27% in the Nifty 50, they also capped the broader market’s upside. The overhang of selling on rallies is likely to continue in banking stocks this week, too.
In the commodities space, crude oil witnessed a sharp decline on the mere possibility of a truce between Iran and the US. While no change was seen in the marine traffic in the Strait of Hormuz, crude oil prices ran ahead of the possibility of the real opening of the shipping lanes. This underscores my long-standing view that energy markets are adequately supplied and there is no supercycle in this asset class. With the expiry of the May oil derivatives series approaching, higher levels are likely to encounter resistance. Barring any unforeseen geopolitical development, I expect oil and gas to slip lower.
Bullion is showing signs of stabilising and even firming up, particularly in silver. This aligns with my long-standing view that my readers should ignore the near-term outlook, which is muddied. The long-term, multi-year outlook remains bullish as ever. Just don’t leverage (buy with borrowed money), please!
Industrial metals are showing signs of perking up. Part of the reason is the weakening US dollar index (DXY), and the other is the continued fear of supply chain disruption. There is also the usual fiat currency debasement trade, alive and kicking. As the buying power of the paper currency erodes, big money takes shelter in buying hard assets (commodities). If you think about it, this is nothing but inflation 101, in the simplest terms. I maintain my view that expectations of supercycles are premature in this segment too. Bull market, yes; supercycle no.
Where stocks are concerned, public sector undertakings are likely to witness renewed action in the near term. There has been a spurt of activity after the West Bengal election results, and this interest may sustain for some time. The noteworthy would be public sector banks after the announcement of State Bank of India’s quarterly results, which fell below expectations. If more public-sector banks report similar results, expect the unwinding to accelerate.
Fixed-income investors should keep their powder dry in anticipation of higher yields that seem to be on the way.
Trade light this week, as the markets seem stuck in a range that benefits theta decay (options writers) at the expense of retail intraday traders. Theta decay is the rate at which an options contract loses its value as its expiration date nears. Maintain stop-losses diligently and continue with tail risk hedges remaining in place.
Rear-view mirror
Let us assess what happened last week so we can gauge what to expect in the coming week.
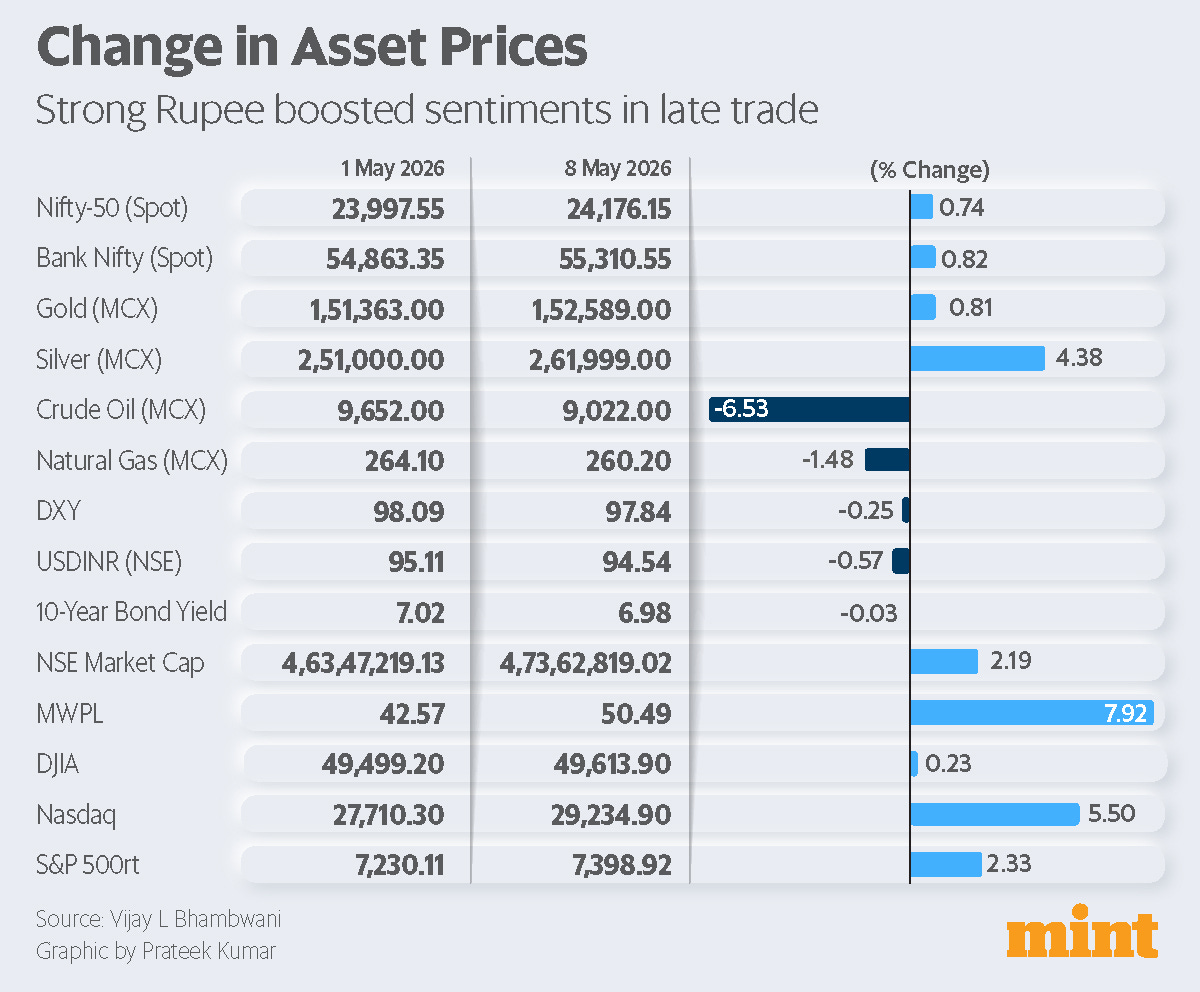
The rally was led by the Bank Nifty, with the broad-based Nifty bringing up the rear. The weakness in the dollar bolstered bullish sentiment in emerging market equities and bullion.
Oil and gas prices fell as hopes of Iran-US peace talks emerged. The rupee staged a late rally versus the dollar. India’s 10-year bond yield eased a little as bond markets paused for breath. The National Stock Exchange clocked 2.19% gain in market capitalisation as retail optimism continued.
The market-wide position limits (MWPL) continued to rise routinely post expiry. US indices rallied in unison, providing tailwinds for our markets.
Retail risk appetite
I use a simple yet highly accurate yardstick for measuring the conviction levels of retail traders—where are they deploying money. I measure the percentage of turnover contributed by lower- and higher-risk instruments.
If they trade more of futures, which require sizeable capital, their risk appetite is higher. In the futures space, index futures are less volatile than stock futures. A higher footprint in stock futures shows higher aggression levels. Ditto for stock and index options.
Last week, this is what their footprint looked like (the numbers are the average of all trading days of the week) —
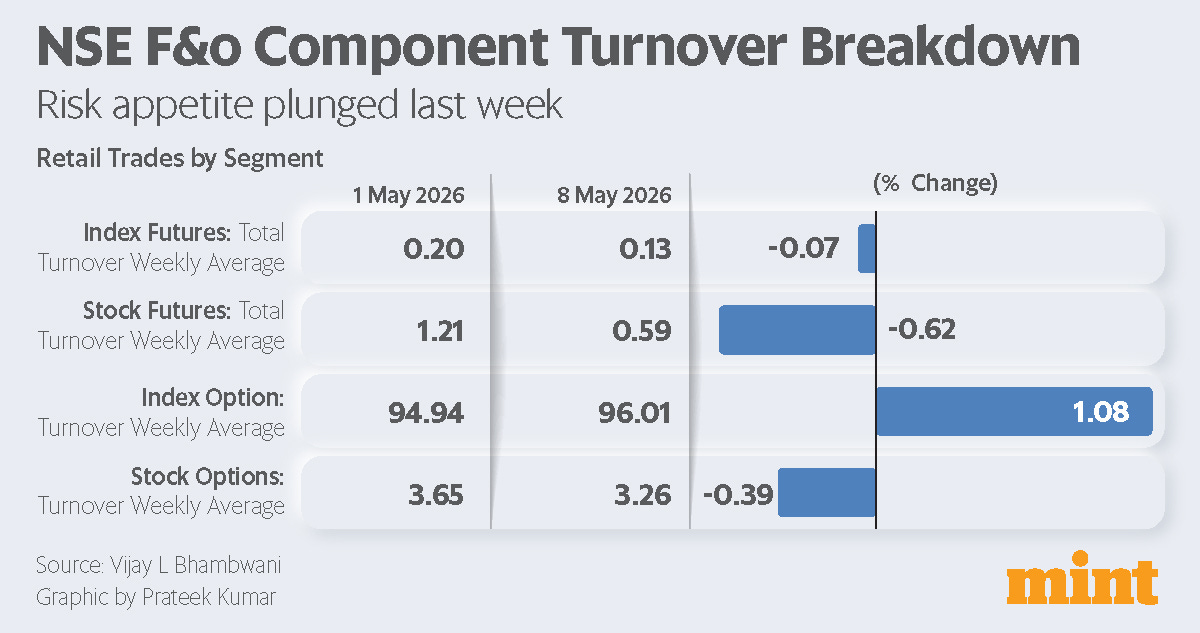
Turnover in the capital-intensive, high-volatility futures segment fell sharply. That tells us the average retail trader was shying away from risk.
In the relatively lower-risk options segment, turnover rose in the lowest-volatility, lowest-capital-intensive index options. That tells me the bulls were going through half-hearted motions of being optimistic.
Matryoshka analysis
Let us peel layer after layer of statistical data to arrive at the core message of the markets.
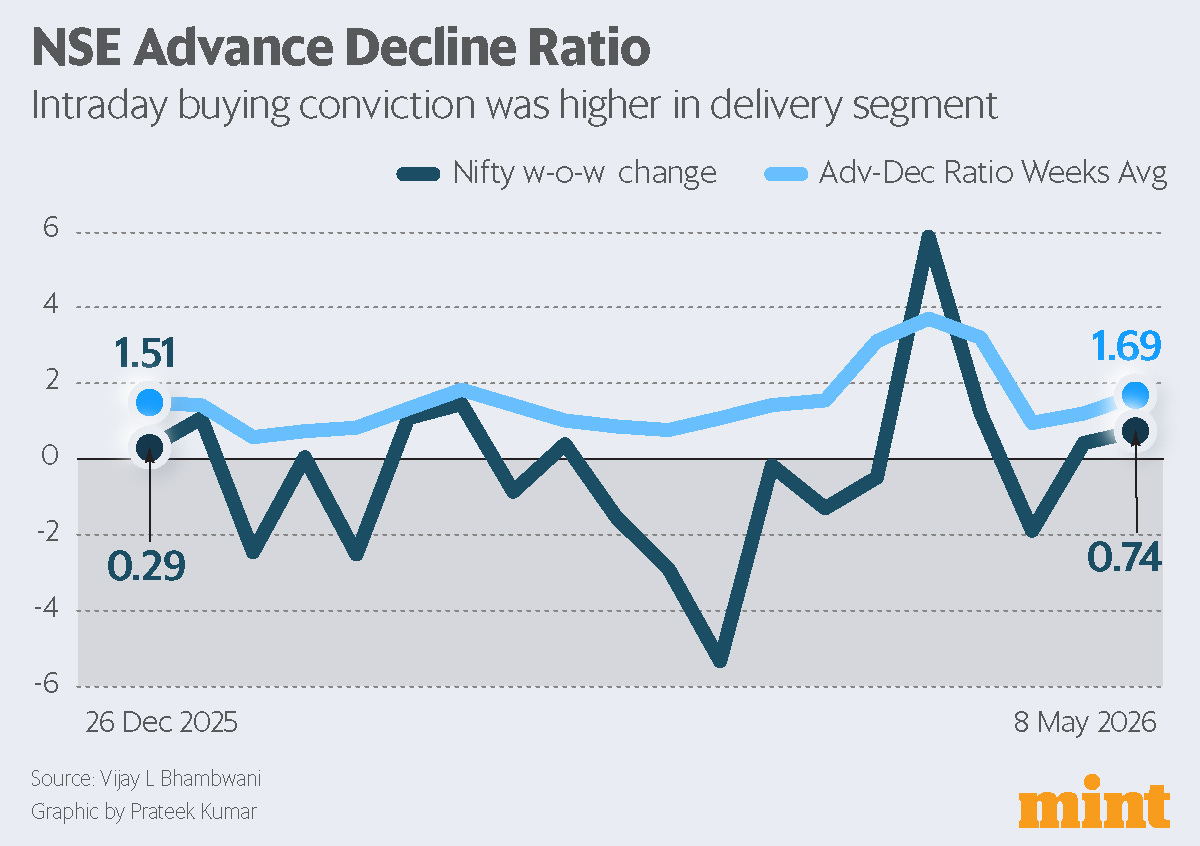
The first chart I share is the NSE advance-decline ratio. After the price itself, this indicator is the fastest (leading) indicator of which way the winds are blowing. This simple yet accurate indicator computes the ratio of rising to falling stocks. As long as the gainers outnumber the losers, the bulls are dominant. This metric gauges the risk appetite of one marshmallow traders. These are pure intraday traders.
While the Nifty clocked mildly higher gains last week, the advance-decline ratio rose in tandem. At 1.69 (prior week 1.22), it indicates there were 169 gainers for every 100 losers. As long as this ratio stays above 1.0 with rising prices, bulls have an upper hand.
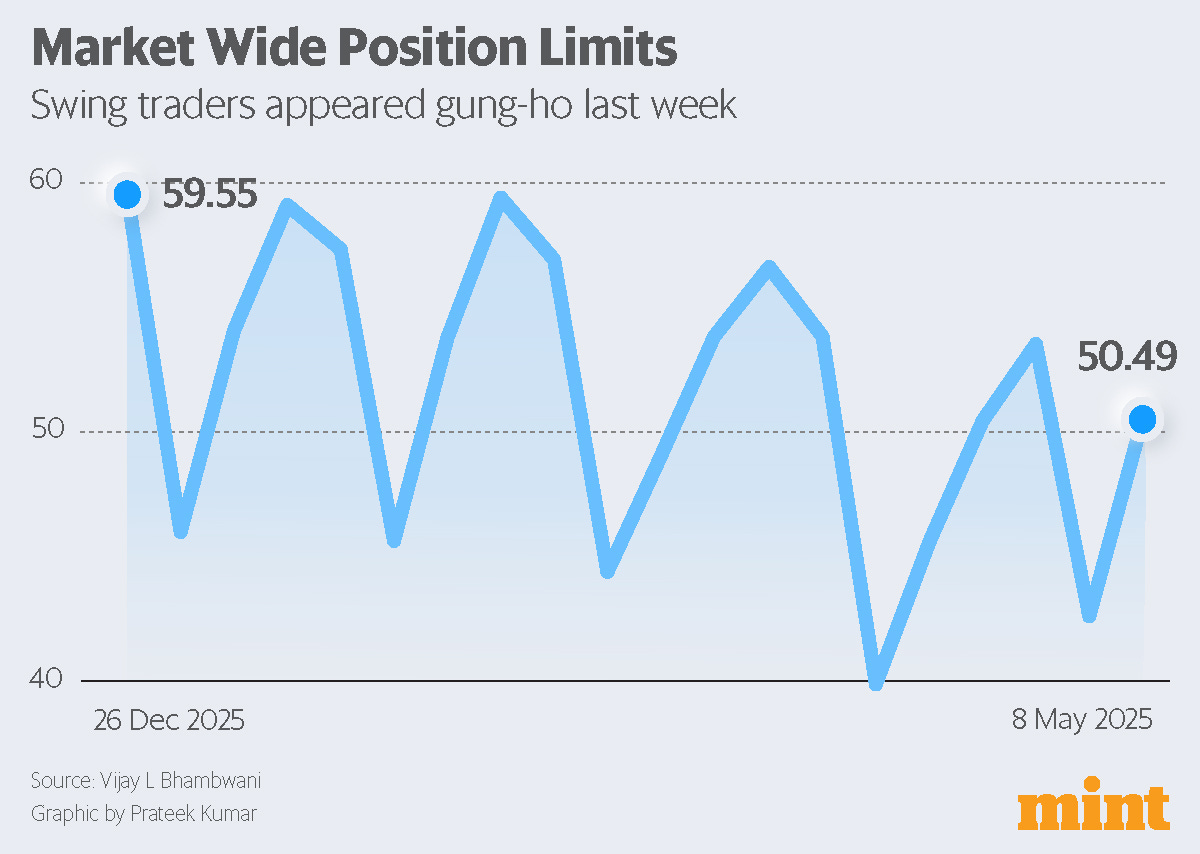
The second chart I share is the market-wide position limits. This measures the amount of exposure traders utilised in the derivatives (F&O) space as a component of the total exposure allowed by the regulator. This metric gauges the risk appetite of two marshmallow traders. These are deep-pocketed, high-conviction traders who roll over their trades to the next session (s).
The MWPL reading rose to 50.49%, higher than the comparable week last month. Do note that the post-expiry low this month was higher than the prior month as well. That suggests swing traders in derivatives (futures and options) are showing signs of increased risk appetite. As long as this number rises with rising prices its advantage for bulls.
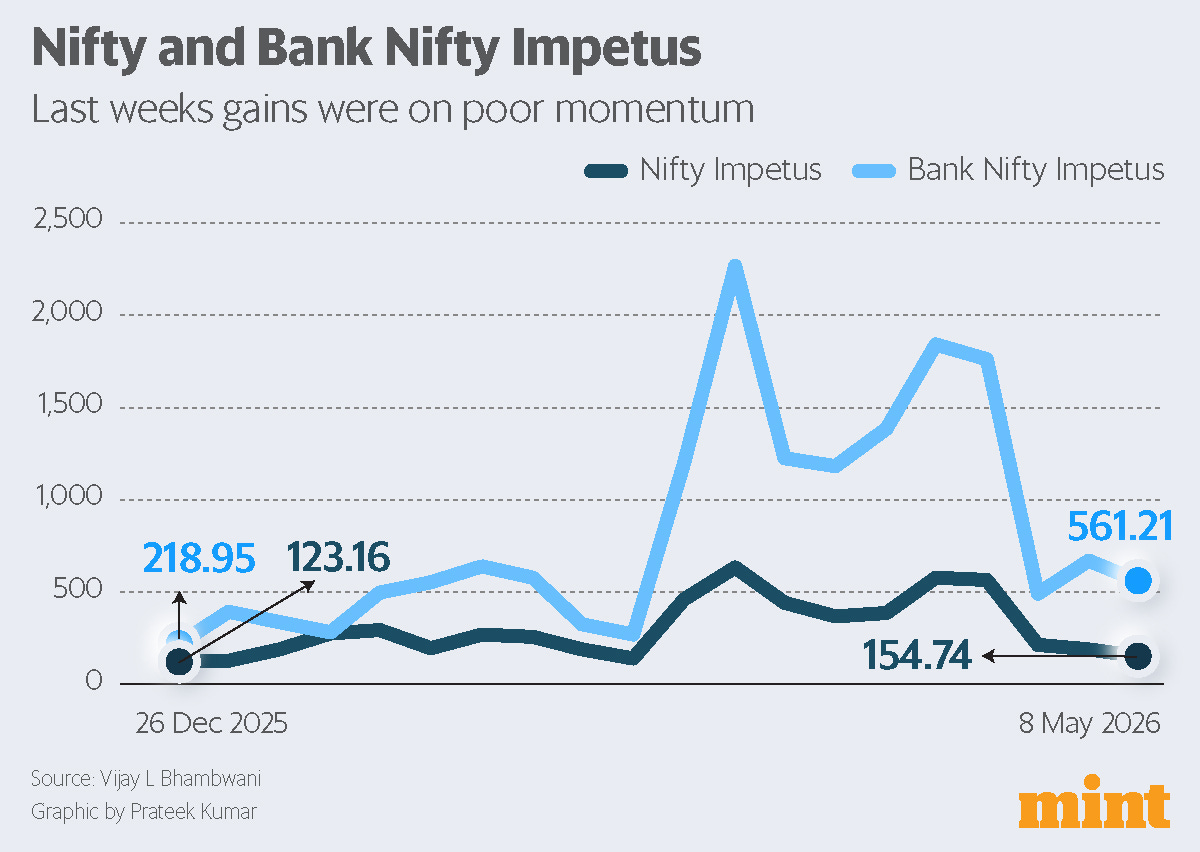
The third chart I share is my in-house indicator ‘impetus’. It measures the force in any price move. Last week, both indices notched gains, but the impetus readings were lower. That means the rally was partly due to short covering and therefore lacked very strong momentum. Either strong follow-up buying emerges, or the gains risk fizzling out.
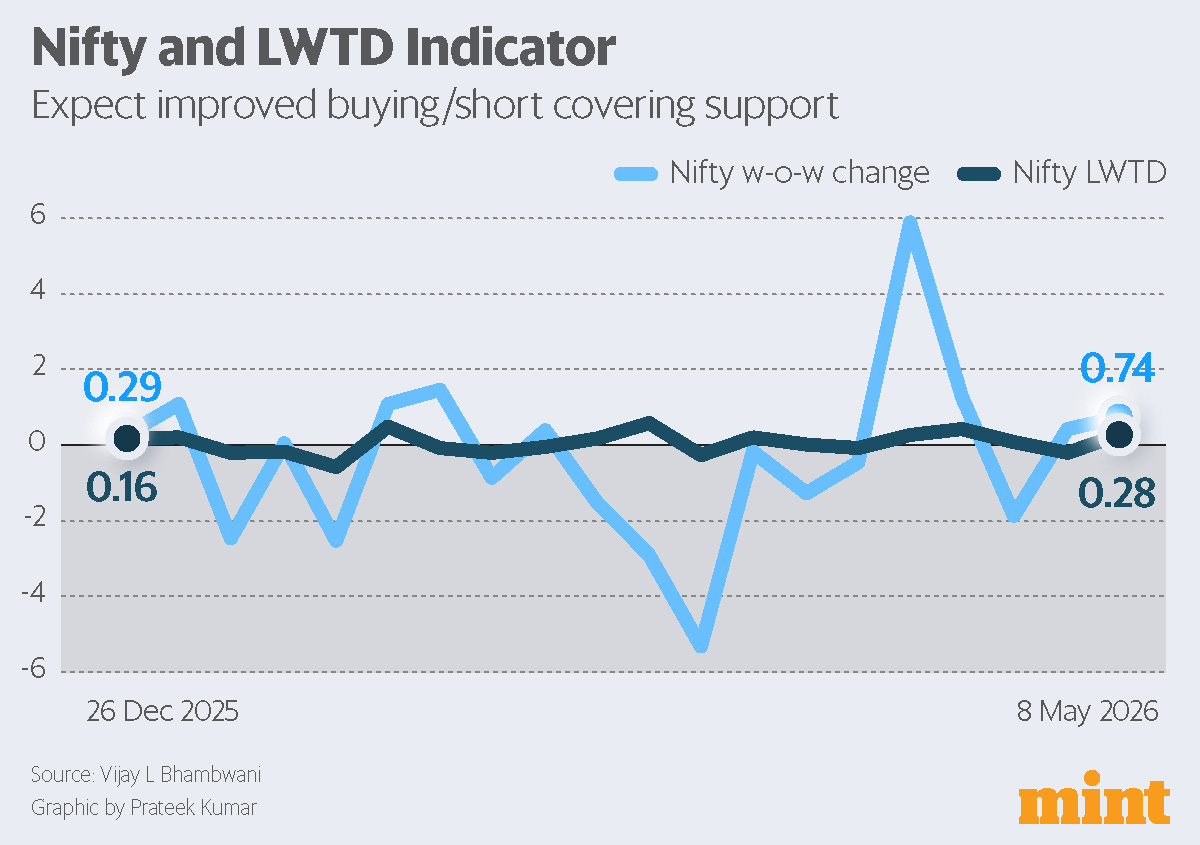
The final chart I share is my in-house indicator ‘LWTD’. It computes lift, weight, thrust and drag encountered by any security. These are four forces any powered aircraft faces in flight, so applying them to traded securities helps a trader estimate prevailing sentiment.
While the Nifty gained 0.74% compared to the prior week’s gains of 0.42%, the LWTD reading leapfrogged to 0.28 (prior week -0.19). Coupled with poor impetus reading, much of the gains in LWTD were triggered by short covering. However, a higher LWTD reading is a welcome sign as short covering can at least cushion declines or even trigger a temporary rally. However, it takes strong fresh buying to push markets to a new high.
Nifty’s verdict
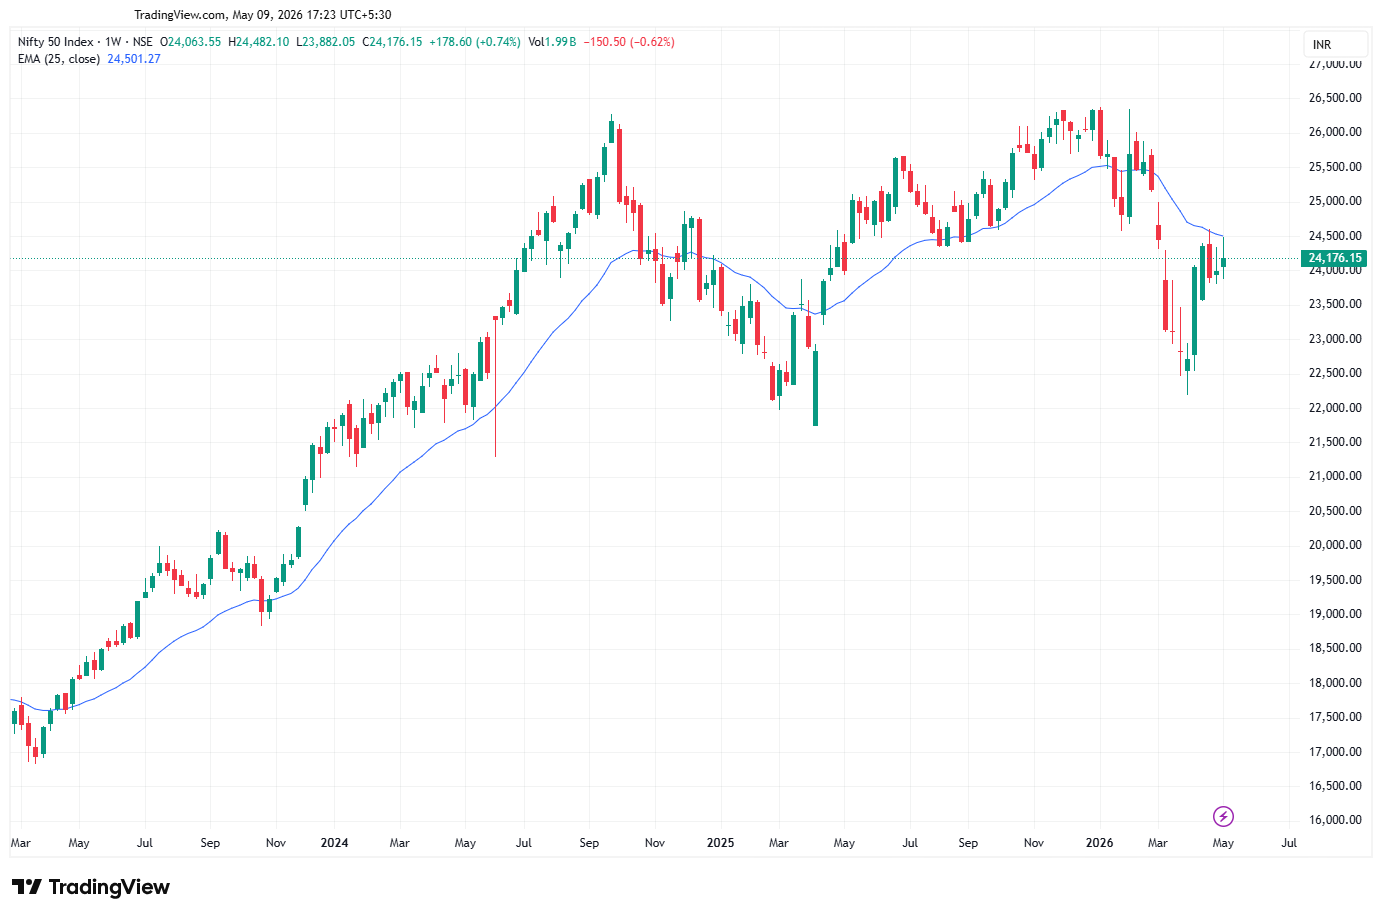
The weekly candle chart of the Nifty shows a small-bodied candle that is unable to rally past the 25-week moving average. This average is a proxy for the six-month average holding cost of a retail investor. That tells me the medium-term outlook remains under pressure for now. The 24,650 hurdle I have been advocating as a precondition for a fresh rally remained in place. Till bulls manage to go past this resistance, the rank and file trader may choose to sit on the fence.
On the flip side, a sustained trade below the 23,882 level may open the doors to fresh declines.
Your call to action
Sustained trade above the 24,650 level indicates the possibility of a fresh rally. Only if this level is overcome confidently can a new bullish phase begin. A sustained trade below the 23,800 level can trigger fresh weakness.
Last week, I estimated ranges of 57,425–52,300 and 24,900–23,075 for the Bank Nifty and Nifty, respectively. Both indices traded within their specified ranges. This week, I estimate ranges of 58,000–52,600 and 25,100–23,250 for the Bank Nifty and Nifty, respectively.
Trade light with strict stop losses. Avoid trading counters with spreads wider than 8 ticks. Have a profitable week.